Python Venn Diagrams — Compucademy

In this article we are going to look at how to create Venn Diagrams with Python. Venn Diagrams are a great invention and are a really handy way to reason about sets. Sets themselves are very important, not just because of the role they play in Mathematics, but also because they are a powerful tool for helping to solve many computational problems.
Python Set Operators
Venn Diagrams are a way to represent the relationships between sets. So, before we dive in to how to create them with Python, let’s review some set operators. Check out the code below.
Notice the chaining of string methods, as in .replace("?", "").lower().split()). This gets rid of the the question mark, converts all words to lower case and splits the sentences on whitespace.
# Define 2 sets
A = set("Do you like green eggs and ham?".replace("?", "").lower().split())
B = set("I do not like green eggs and ham".lower().split())operators = [
 A == B,  # A is equivalent to B
 A != B,  # A is not equivalent to B
 A <= B,  # A is a subset of B
 A < B,  # A is a proper subset of B
 A >= B,  # A is a superset of B
 A > B,  # A is a proper superset of B
 A | B,  # The union of A and B
 A & B,  # the intersection of A and B
 A - B,  # The set of elements in A but not B
 A ^ B,  # the set of elements in precisely one of A or B
 "green" in A,  # Containment check
 "green" not in A,  # Non-containment check
]
for operator in operators:
 print(operator)
Console output:
False
True
False
False
False
False
{'and', 'green', 'eggs', 'not', 'do', 'you', 'i', 'like', 'ham'}
{'and', 'green', 'eggs', 'do', 'like', 'ham'}
{'you'}
{'not', 'you', 'i'}
True
False
Do you like green eggs and ham?
OK, onto Venn diagrams. We are going to use matplotlib along with the matplotlib-venn library, so you will need to have these installed. Probably the easiest way is using pip install matplotlib and pip install matplotlib-venn from a command line with administrative privileges.
Matplotlib-venn has several types of diagram you can work with. Here we are going to use venn2, which shows the relationship between 2 sets. For the first example, we are going to use venn2_unweighted so that the circles are both the same size regardless of the set contents.
Code Listing for Python Unweighted Venn Diagram Example
import matplotlib.pyplot as plt
from matplotlib_venn import venn2_unweighted# Define 2 sets
A = set("Do you like green eggs and ham?".replace("?", "").lower().split())
B = set("I do not like green eggs and ham".lower().split())# Create and instance of a venn diagram with 2 areas
diagram = venn2_unweighted([A, B], ("Set A", "Set B"))# Set text content of areas
diagram.get_label_by_id("10").set_text("\n".join(A - B))
diagram.get_label_by_id("11").set_text("\n".join(A & B))
diagram.get_label_by_id("01").set_text("\n".join(B - A))# Modify font sizes
for text in diagram.set_labels:
 text.set_fontsize(24)
for text in diagram.subset_labels:
 text.set_fontsize(20)plt.gcf().canvas.set_window_title('Fun With Venn Diagrams')  # Set window title
plt.show()
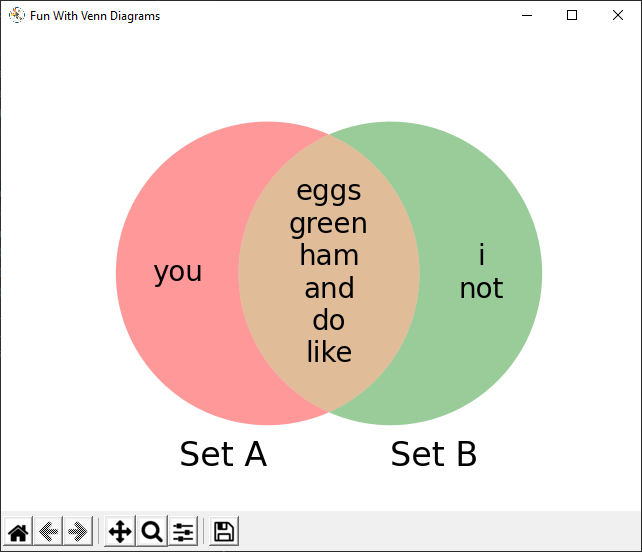
This code produces the diagram shown in the featured image at the top of this article.
An important thing to understand about venn2 diagrams is that the areas are 10, 11, 01 for the left-hand circle, the intersection and the right-hand circle respectively. You can see in the code how access these areas.
Top tip: when working with an unfamiliar package like
matplotlib-venn, it is really handy to have an IDE that offers code-completion suggestions. That way you get to see what is possible for an object you have created without the need to constantly refer to the documentation.
Weighted Venn Diagrams with Python
What we did above made use of venn2_unweighted. However, the default behaviour for venn2 is to adjust the size of the circles relative to their contents. Check out the code below to see the difference.
Code Listing for Python Weighted Venn Diagram Example
import matplotlib.pyplot as plt
from matplotlib_venn import venn2# Define 2 sets
A = set("Do you like green eggs and ham?".replace("?", "").lower().split())
B = set("I do not like green eggs and ham".lower().split())# Create and instance of a venn diagram with 2 areas
diagram = venn2([A, B], ("Set A", "Set B"))# Set text content of areas
diagram.get_label_by_id("10").set_text("\n".join(A - B))
diagram.get_label_by_id("11").set_text("\n".join(A & B))
diagram.get_label_by_id("01").set_text("\n".join(B - A))# Modify font sizes
for text in diagram.set_labels:
 text.set_fontsize(24)
for text in diagram.subset_labels:
 text.set_fontsize(14)plt.gcf().canvas.set_window_title('Fun With Venn Diagrams')  # Set window title
plt.show()
You can see that the size of the regions varies with what they contain.

This was and introduction to drawing Venn Diagrams with Python and matplotlib-venn. Hopefully it has given you enough information to get started making your own Venn Diagrams. To learn more you can check out the project homepage here.
Happy Computing.
Originally published at https://compucademy.net.
